
Diagnosing the problem
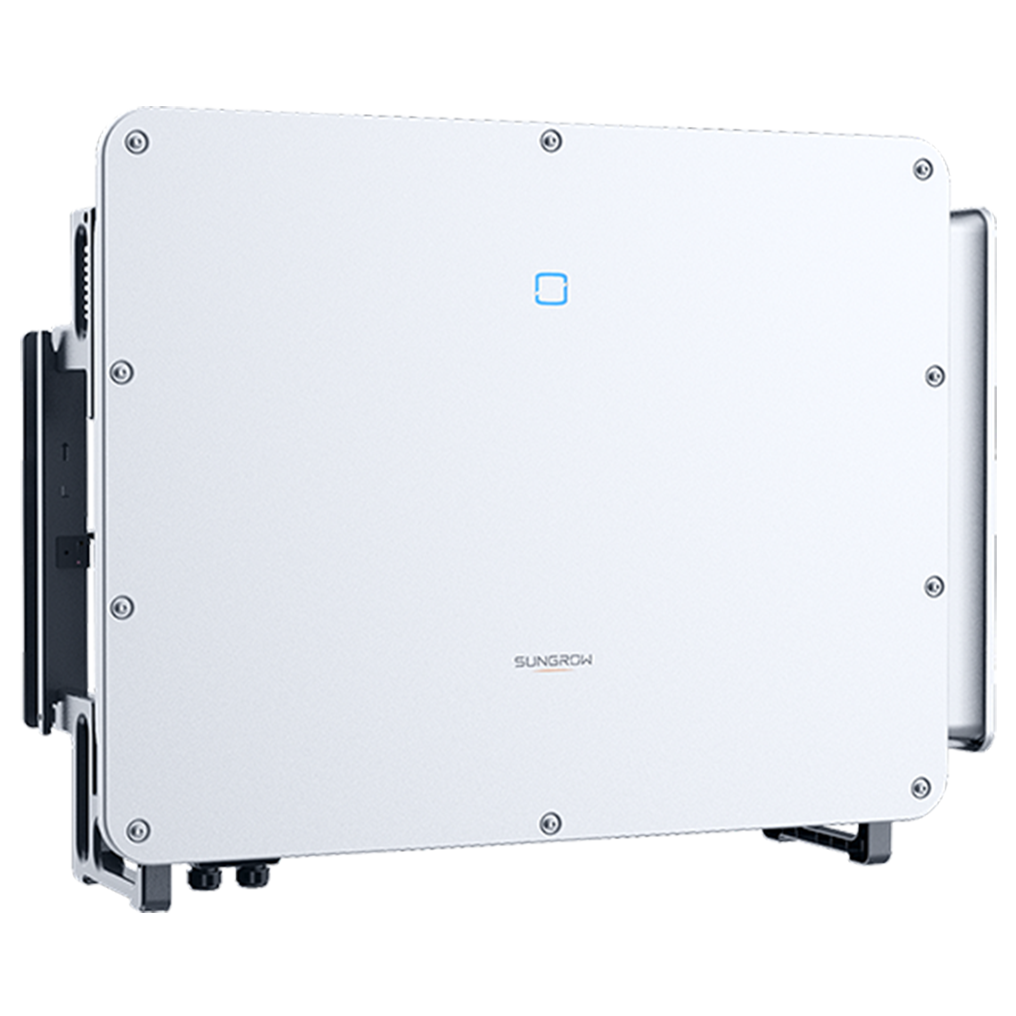
An inverter, MPPT controller and the PV array together define how a commercial installation delivers usable power; their mismatches create the real operational overhead. C&I Solar projects using commercial solar energy often stumble not from panel efficiency but from timing and controls—peak demand, poor dispatch, and billing artifacts. I’ve been on the floor for over 15 years; I can still picture a Chicago warehouse in March 2021 where a 200 kW PV array routinely produced 175 kW at noon yet the site saw only an 18% drop in monthly demand charges (that detail matters).
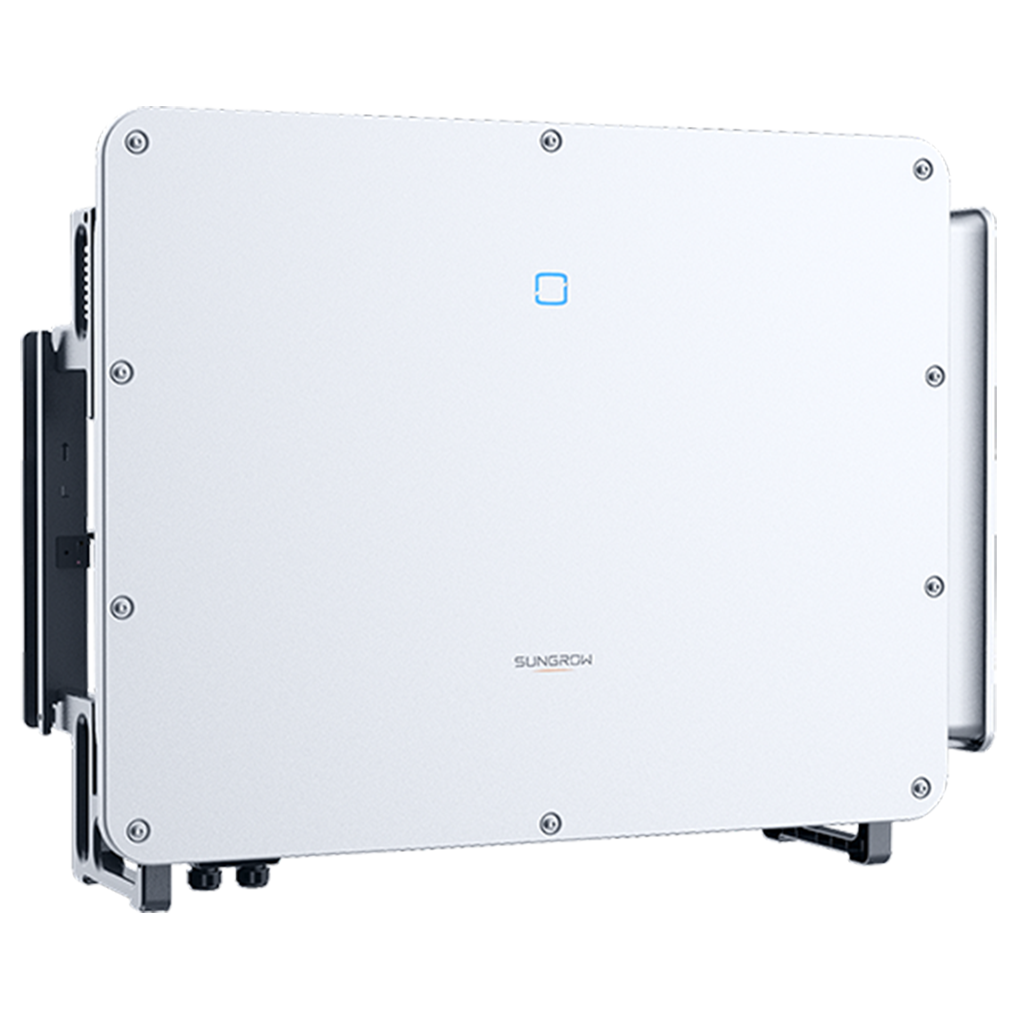
Scenario: midday export suppressed by a grid-tie limit; Data: 175 kW production vs. a 250 kW facility load and persistent demand peaks; Question: how do you cut demand peaks rather than just count kilowatt-hours? That exact gap—generation profile versus load profile—is the hidden pain point I keep seeing. I recall specifying a 150 kWh energy storage bank and a control rewrite after week two; demand peaks fell, yes, but we also discovered telemetry gaps and a misconfigured MPPT that throttled output when the site needed it most. My view: traditional fixes (bigger arrays, simpler net metering) miss instrument-level faults and billing geometry. Next I map the corrective strategies I chose and why they worked.
—Proceeding to practical fixes below.
Forward-looking fixes and trade-offs
What’s Next
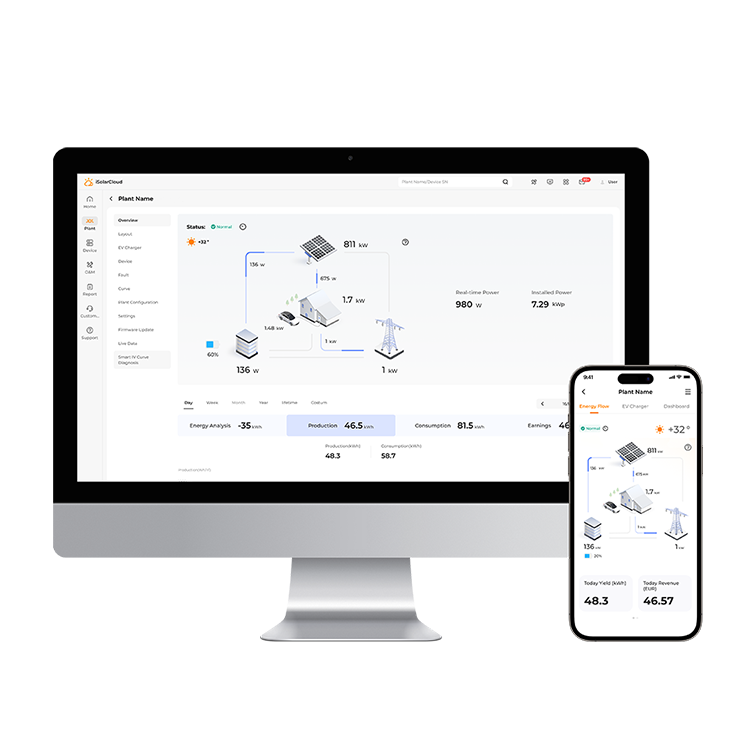
We moved from diagnosis to targeted interventions: finer-grained monitoring, a control layer that coordinates inverter setpoints with onsite load controllers, and a modest energy storage buffer sized to shave the top 20% of the load curve. In practice I selected a modular string inverter architecture and separated the telemetry tiers—local PLC logging, then cloud telemetry—for reliability; that choice reduced incident mean-time-to-resolution in one facility from 36 hours to under 6 hours (measured over four months). For teams thinking about future deployments, note this: adding storage changes economics immediately (you trade CAPEX for avoided demand charges), and adding a dispatch controller changes outcomes (you get predictability). We tested a policy that prioritized demand shaving over maximum export—this cut peak billing by another 10% across two quarters. I should add — yes, there was upfront software work. The controls tie into the same PV array and inverter stack but require real-time setpoint coordination, not batch shifts at midnight.
Evaluation metrics and next-step checklist
I present three practical evaluation metrics I use when choosing solutions for commercial installations: 1) Peak reduction ratio (percentage drop in monthly demand charge after controls and storage), 2) Instrumentation coverage (percent of critical meters and inverters with sub-minute telemetry), and 3) Recovery time (mean time to detect and repair a control or inverter fault). I measure each in kWh-equivalent or dollars per month, so the board can see payback clearly. I learned this the hard way in a retail park deployment in June 2019 where poor instrumentation hid a wiring fault for six weeks; the missing data cost us an avoidable $4,200 demand penalty that month. Short story: invest in diagnostics first, then hardware—storage, inverter sizing, and fine-tuned MPPT control follow. We made those calls; they saved real money. For ongoing projects I still push for clear SLAs on telemetry and control updates, because the software gap is where most projects fail (not the panels). Finally, for vendor selection weigh those three metrics first, then compare warranties and O&M practices. Closing thought—commercial decisions are technical and human; choose accordingly. sungrow